The Hidden Labor Costs Killing HVAC Profits: 5 Dispatch Inefficiencies North Texas Contractors Miss
Your technicians are working harder than ever. Your revenue is up. So why are profit margins shrinking? The answer is hiding in how you dispatch, route, and manage field operations—costing you $3,000-$8,000 monthly.
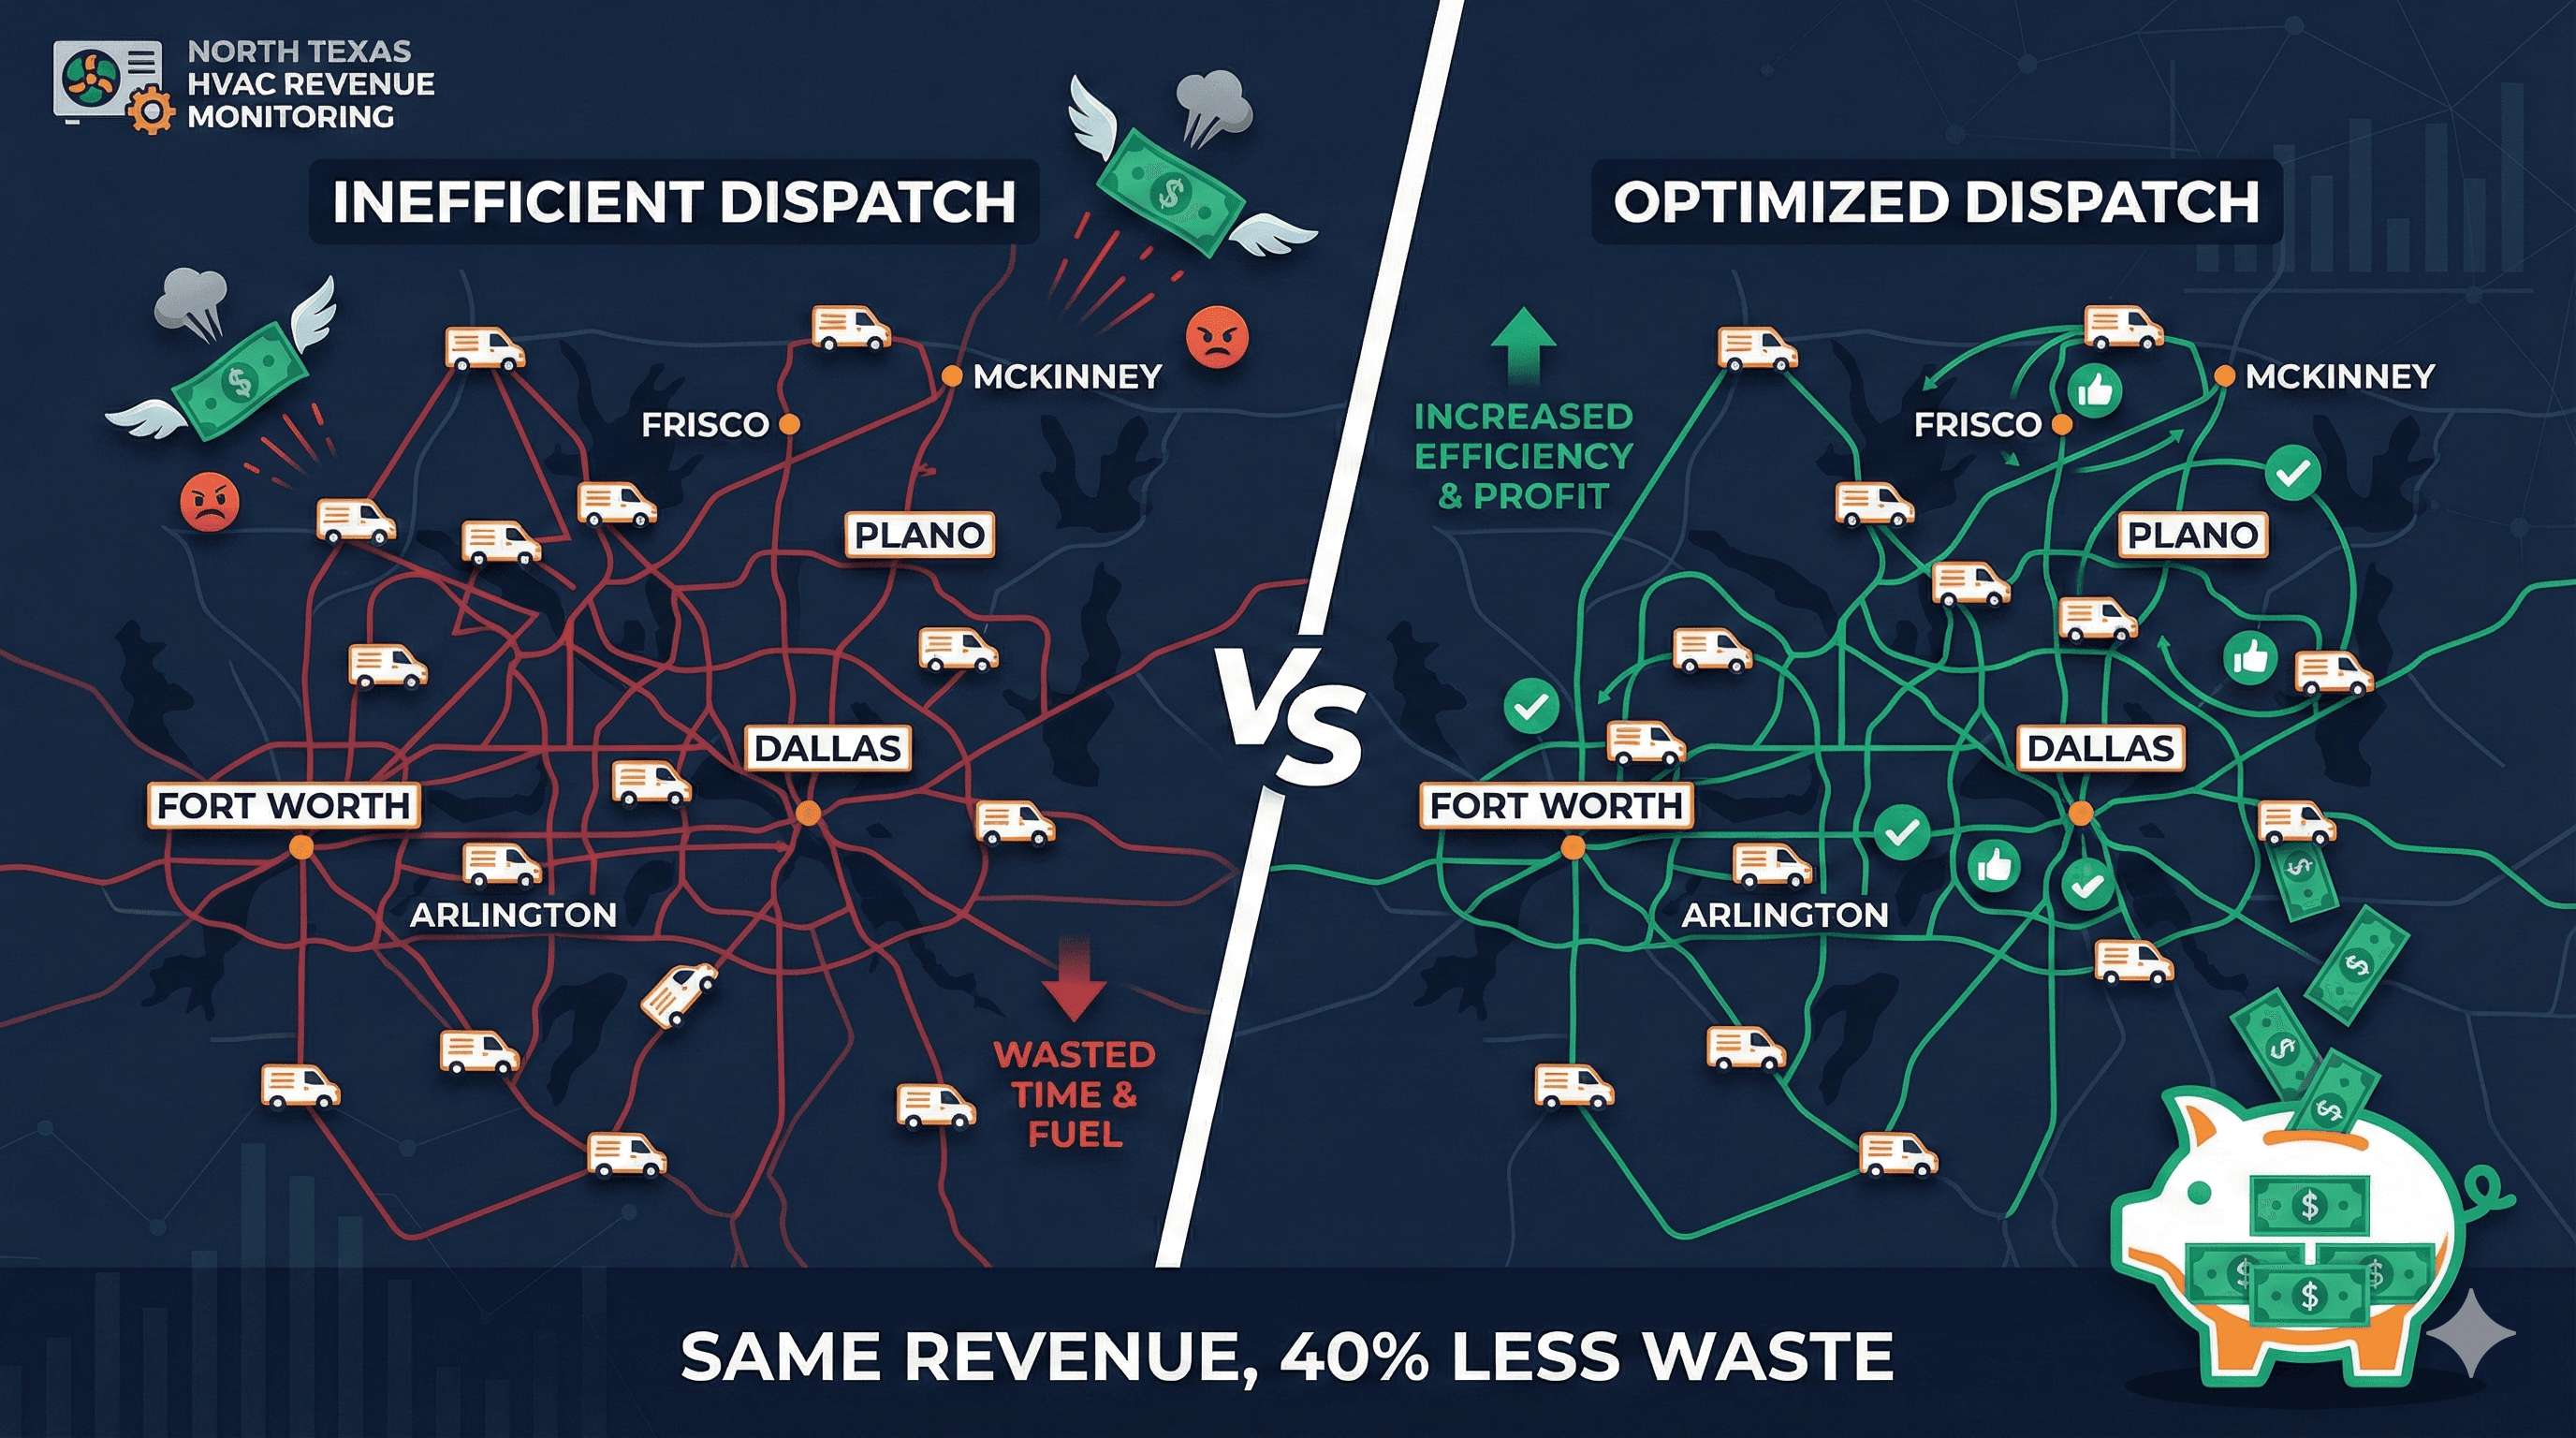
The Profit Paradox: Revenue Up, Margins Down
You're the busiest you've ever been. Your techs are running calls from 7am to 8pm. ServiceTitan shows solid booking rates. Your revenue is up 12% year-over-year.
But when you look at profit margins, they're down 8-10% from last year. Your labor costs feel out of control. You wonder if you need to raise prices again or cut staff. Neither feels right.
Here's what's actually happening: Your team is working hard, but not efficiently. The hidden culprit isn't effort—it's operational inefficiency silently draining profits.
The Daily Waste Equation
5 trucks × 2 wasted hours daily × $85 loaded labor rate = $850/day = $4,250/week = $18,700/month in pure operational waste.
That's the reality for a typical 5-truck North Texas HVAC operation. The waste isn't dramatic—it's death by a thousand small inefficiencies. And unlike missed calls or lost estimates, you can't see it without deliberately looking for it.
Why DFW Geography Makes Dispatch Efficiency Critical
If you're running HVAC operations in North Texas, you're dealing with unique geographic challenges that multiply dispatch inefficiencies:
- Massive metro spread: The DFW metroplex covers 9,286 square miles
- Long drive times: Plano to Fort Worth is 47 minutes off-peak, 68 minutes during rush hour
- Traffic unpredictability: I-35, I-30, and Central Expressway add 15-30 minutes during peak
- Heat multiplier: Summer emergencies make every delay more costly ($875-1,200 per emergency call)
- Competition density: 500+ licensed contractors in DFW means customers won't wait if you're late
Every inefficiency that would cost you $100 in a compact market costs you $150-200 in North Texas. Geographic spread isn't just inconvenient—it actively punishes poor dispatch efficiency.
The 5 Dispatch Inefficiencies Draining Your Profit
Inefficiency #1: Poor Job Stacking and Route Optimization
The Problem: Your techs zigzag across DFW—Plano morning job, Arlington afternoon, back to Frisco for an evening call.
What You Don't See: How many miles and hours are wasted on inefficient routing. Your dispatch board shows jobs getting done, but it doesn't show the invisible cost of poorly planned routes.
Real Cost Example:
Tech drives 87 miles to complete 3 jobs that could've been 42 miles with proper geographic clustering.
• 45 extra miles × $0.67/mile (IRS rate) = $30.15 in vehicle costs
• 1.5 hours wasted drive time × $85 loaded labor rate = $127.50 in labor waste
Total daily waste per tech: $158
North Texas Multiplier: With 5 trucks running inefficient routes, that's $790 daily = $3,950/week = $205,400 annually.
Action Steps:
- Implement route optimization software (OptimoRoute, WorkWave)
- Cluster jobs by geography during morning dispatch planning
- Track miles per completed job as a KPI
- Set geographic zones and try to keep techs within their zone
Inefficiency #2: First-Job Delay (Techs Starting Late)
The Problem: Techs arrive at the shop at 7:30am, spend 30 minutes prepping trucks and chatting, first job doesn't start until 8:15am instead of 7:30am.
What You Don't Track: Actual first-job start time vs. scheduled start time. Your morning feels busy, but productive work starts 45 minutes late every single day.
Hidden Cost Calculation:
45 minutes × 5 techs × $85 loaded rate = $318.75 daily
$318.75 × 5 days/week × 52 weeks = $82,875 annually
North Texas Pattern: Morning traffic on Central Expressway and I-35 means late starts compound throughout the day. A tech starting at 8:15 instead of 7:30 hits worse traffic, making second and third jobs even later.
Action Steps:
- Implement direct-to-site dispatch (techs go straight to first job from home)
- Evening truck prep protocols (stock trucks night before)
- GPS timestamping to track actual first-job arrival times
- Set clear accountability metrics: first job starts by 7:30am
Inefficiency #3: Job Overruns Without Accountability
The Problem: Diagnostic scheduled for 60 minutes, tech spends 105 minutes, no flag in your system. You only notice when you review job reports at the end of the week—or month.
What You're Missing: Which techs consistently run over time vs. which are efficient. Without real-time tracking, slow techs blend in with your fast ones, dragging down your overall productivity.
Case Study: Plano Contractor Discovery
8-truck operation found that 3 of 8 techs averaged 20% longer job times than their peers for identical work.
• 3 slow techs × 6 jobs daily × 0.5 hours extra per job = 9 hours daily waste
• 9 hours × $85 loaded rate = $765 daily
Monthly waste: $3,825 | Annual: $45,900
Root Causes:
- • Inadequate training on specific equipment
- • Poor time estimation skills
- • Lack of accountability (no one's watching)
- • Perfectionism without business awareness
Action Steps:
- Benchmark time-per-job-type across all techs
- Create tech performance dashboards (actual vs. estimated time)
- Real-time alerts for jobs running >20% over time
- Targeted coaching for consistently slow techs
- Reward efficiency, not just revenue per tech
Inefficiency #4: Administrative Time Waste (Paperwork, Parts Runs)
The Problem: Each tech spends 45 minutes daily on paperwork, trips to supply houses, waiting for parts, and other non-billable administrative tasks.
What ServiceTitan Doesn't Show: Non-billable time breakdown by tech. You see completed jobs and revenue, but the hours spent on administrative overhead are invisible.
The Hidden Burden:
45 minutes per tech per day × 5 techs × 250 workdays = 937.5 hours annually
937.5 hours × $85 loaded labor rate = $79,687 in lost productivity
North Texas Factor: Supply house traffic during peak times (10am-2pm) on Jupiter Road, Harry Hines, or I-35 adds 30+ minutes to what should be a quick parts run.
Typical Time Wasters:
- • Manual paperwork after each job (15 min)
- • Supply house parts runs during the day (35 min including drive and wait)
- • Waiting for parts to be pulled at distributor (20 min)
- • End-of-day reporting and admin (25 min)
Solutions:
- Mobile invoicing and digital forms (eliminate paperwork delays)
- Stock trucks properly with commonly needed parts
- Bulk morning parts runs before techs start (one runner gets parts for all jobs)
- Dedicated parts runner role (one person handles all parts runs for team)
- Pre-ordered parts with morning delivery from distributors
Inefficiency #5: Callback Trips from Incomplete Jobs
The Problem: Tech forgets a part, doesn't complete diagnostic properly, or misses something—requiring a return trip the next day.
What You Don't Track: Callback rate by technician. Which techs have 12% callback rates vs. 3%? That difference is massive when multiplied across hundreds of jobs.
True Cost of Callbacks:
Second trip drive time (45 min) + labor (60 min) + customer frustration = $280-450 per callback
Industry average: 8-12% of jobs require callbacks
Best-in-class: Less than 3% callback rate
For 100 jobs/month: 12% callbacks = $3,600 monthly | 3% = $900 monthly
Difference: $2,700/month = $32,400 annually
North Texas Impact: Geographic spread makes callbacks doubly expensive. A callback in Arlington when your shop is in Plano costs 90 minutes of drive time alone.
Common Callback Causes:
- • Forgot a specific part needed for the job
- • Incomplete diagnostic (missed secondary issue)
- • Incorrect part ordered
- • Rushed job due to time pressure
- • Lack of pre-job planning
Prevention Methods:
- Pre-job checklists (review job details and stock needed parts)
- Truck inventory audits (ensure common parts are stocked)
- Track first-time fix rate as a KPI by technician
- Post-job verification checklist before leaving site
- Customer communication protocols (set expectations, verify satisfaction)
How These Inefficiencies Compound During Peak Season
During North Texas summer surge (mid-June through mid-September), every inefficiency multiplies:
- Poor routing: More jobs means more opportunities for inefficient routes. A 20% routing inefficiency on 6 daily jobs is worse than on 4 jobs.
- First-job delays: Every lost morning minute cascades into evening overtime. Starting 45 minutes late during peak means techs work until 9pm instead of 8pm.
- Job overruns: Emergency calls compound time pressure. A tech who runs 20% over during slow season runs 35% over when stressed.
- Administrative waste: More jobs = more paperwork, more parts runs, more chaos. 45 min/day becomes 75 min/day during peak.
- Callbacks: Rushed jobs lead to more callbacks. Your 8% callback rate jumps to 14% when techs are overwhelmed.
Peak Season Impact Example:
All 5 inefficiencies active during slow season = $5,200/month waste
All 5 inefficiencies compounding during peak season = $8,200-12,000/month waste
This is why your profit margins crater during your busiest months. More revenue, yes—but exponentially more operational waste eating into that revenue.
What DFW HVAC Contractors Discovered (And Recovered)
Case Study 1: McKinney Residential HVAC (8 trucks)
Baseline: $11,200 monthly operational waste identified through 2-week audit
Focus Areas: Route optimization + first-job delays
Changes Implemented:
- Moved to geographic dispatch zones
- Implemented direct-to-site morning dispatch
- Evening truck prep protocols
- GPS tracking with first-job start time alerts
Result: Recovered $6,800 monthly (61% improvement) with zero additional hires
Case Study 2: Fort Worth Commercial Contractor (12 techs)
Problem: Job overruns averaging 23% over estimated time
Discovery: 4 techs needed additional training, 2 had consistently bad time estimation habits
Fix: Benchmarking system + individual coaching + real-time alerts for jobs running >20% over
Result: $9,400 monthly labor cost reduction (job time variance dropped from 23% to 8%)
Case Study 3: Frisco Full-Service Company (6 trucks)
Issue: Administrative time waste averaging 73 minutes per tech per day on paperwork and parts runs
Solution: Streamlined mobile workflow + dedicated morning parts runner role + better truck stocking
Time Savings: Reduced admin time from 73 min/day to 25 min/day per tech
Savings: 4.8 hours daily across team = $3,672/month recovered in productive hours
The 7-Day Dispatch Efficiency Audit (Free DIY Method)
You don't need expensive software to identify your biggest waste areas. Here's how to audit your dispatch efficiency in 7 days:
Track These 5 Metrics Daily:
1. First-Job Start Time (Actual vs. Scheduled)
GPS timestamp or manual log. Goal: <5 minutes variance
2. Total Drive Miles Per Tech Per Day
Odometer reading start/end of day. Benchmark: <60 miles for 4-5 jobs
3. Job Duration vs. Estimated Duration
Track by tech and job type. Goal: Within 15% of estimate
4. Non-Billable Time (Paperwork, Parts Runs, Breaks)
Have techs log all non-job time. Target: <45 min/day
5. Callback Trips
Track return visits by tech. Goal: <3% of completed jobs
After 7 Days:
- Calculate total wasted hours across all 5 categories
- Multiply by your loaded labor rate ($82-88/hour typical for North Texas)
- Multiply by 20 workdays to get monthly waste
- Identify your top 2 inefficiency categories
- Focus improvement efforts on the biggest waste areas first
Tools That Fix Dispatch Inefficiency (Without Replacing ServiceTitan)
ServiceTitan tracks jobs completed, but it doesn't track dispatch efficiency. Here are tools that fill the gap:
GPS Tracking / Fleet Management
Tools: Samsara, Verizon Connect, Geotab
What It Solves: Route inefficiency, first-job delays, unauthorized stops
Route Optimization
Tools: OptimoRoute, WorkWave, Route4Me
What It Solves: Poor job stacking, excessive drive time, geographic inefficiency
Real-Time Dispatch Alerts
Tools: Custom ServiceTitan integrations, North Texas Operations monitoring
What It Solves: Job overruns, late arrivals, callback patterns
Tech Performance Dashboards
Tools: Custom reporting layers on top of ServiceTitan
What It Solves: Identifies slow techs, tracks efficiency metrics, enables coaching
What North Texas Operations Does
We provide a monitoring layer on top of your existing ServiceTitan setup that tracks these exact dispatch inefficiencies in real-time. You get alerts when waste happens (job running 25% over, tech started late, inefficient route detected) so you can fix it immediately instead of discovering it weeks later in reports.
Your 90-Day Dispatch Efficiency Improvement Plan
Week 1: Baseline Audit
Track the 5 key metrics. Calculate total monthly waste. Identify top 2 inefficiencies.
Weeks 2-4: Fix First-Job Delays (Quick Win)
Implement direct-to-site dispatch or strict first-job start accountability. This is the easiest inefficiency to fix and shows immediate ROI.
Weeks 5-8: Implement Route Optimization
Set up geographic zones or route optimization software. Train dispatchers on clustering jobs by location.
Weeks 9-12: Address Job Overruns Through Coaching
Benchmark tech performance. Coach slow techs. Set time targets by job type. Implement real-time overrun alerts.
Ongoing: Monitor and Optimize
Track metrics weekly. Address administrative waste and callbacks as you refine other areas. Continuous improvement mindset.
Ready to Find Your Hidden Waste?
Get a free 7-day dispatch efficiency audit. We'll track these exact 5 inefficiencies in your operation and show you exactly where $3K-8K monthly is hiding.
No software to install. No disruption to your team. Most contractors find $8K+ monthly.
Related Articles
Why North Texas HVAC Techs Quit (And the $40K+ Replacement Tax)
Dispatch inefficiency doesn't just drain profits—it burns out technicians and drives $30K-50K turnover costs.
The 7 HVAC KPIs You're Not Tracking in 2026
Want to track dispatch efficiency? Here are the KPIs you need to measure operational performance.