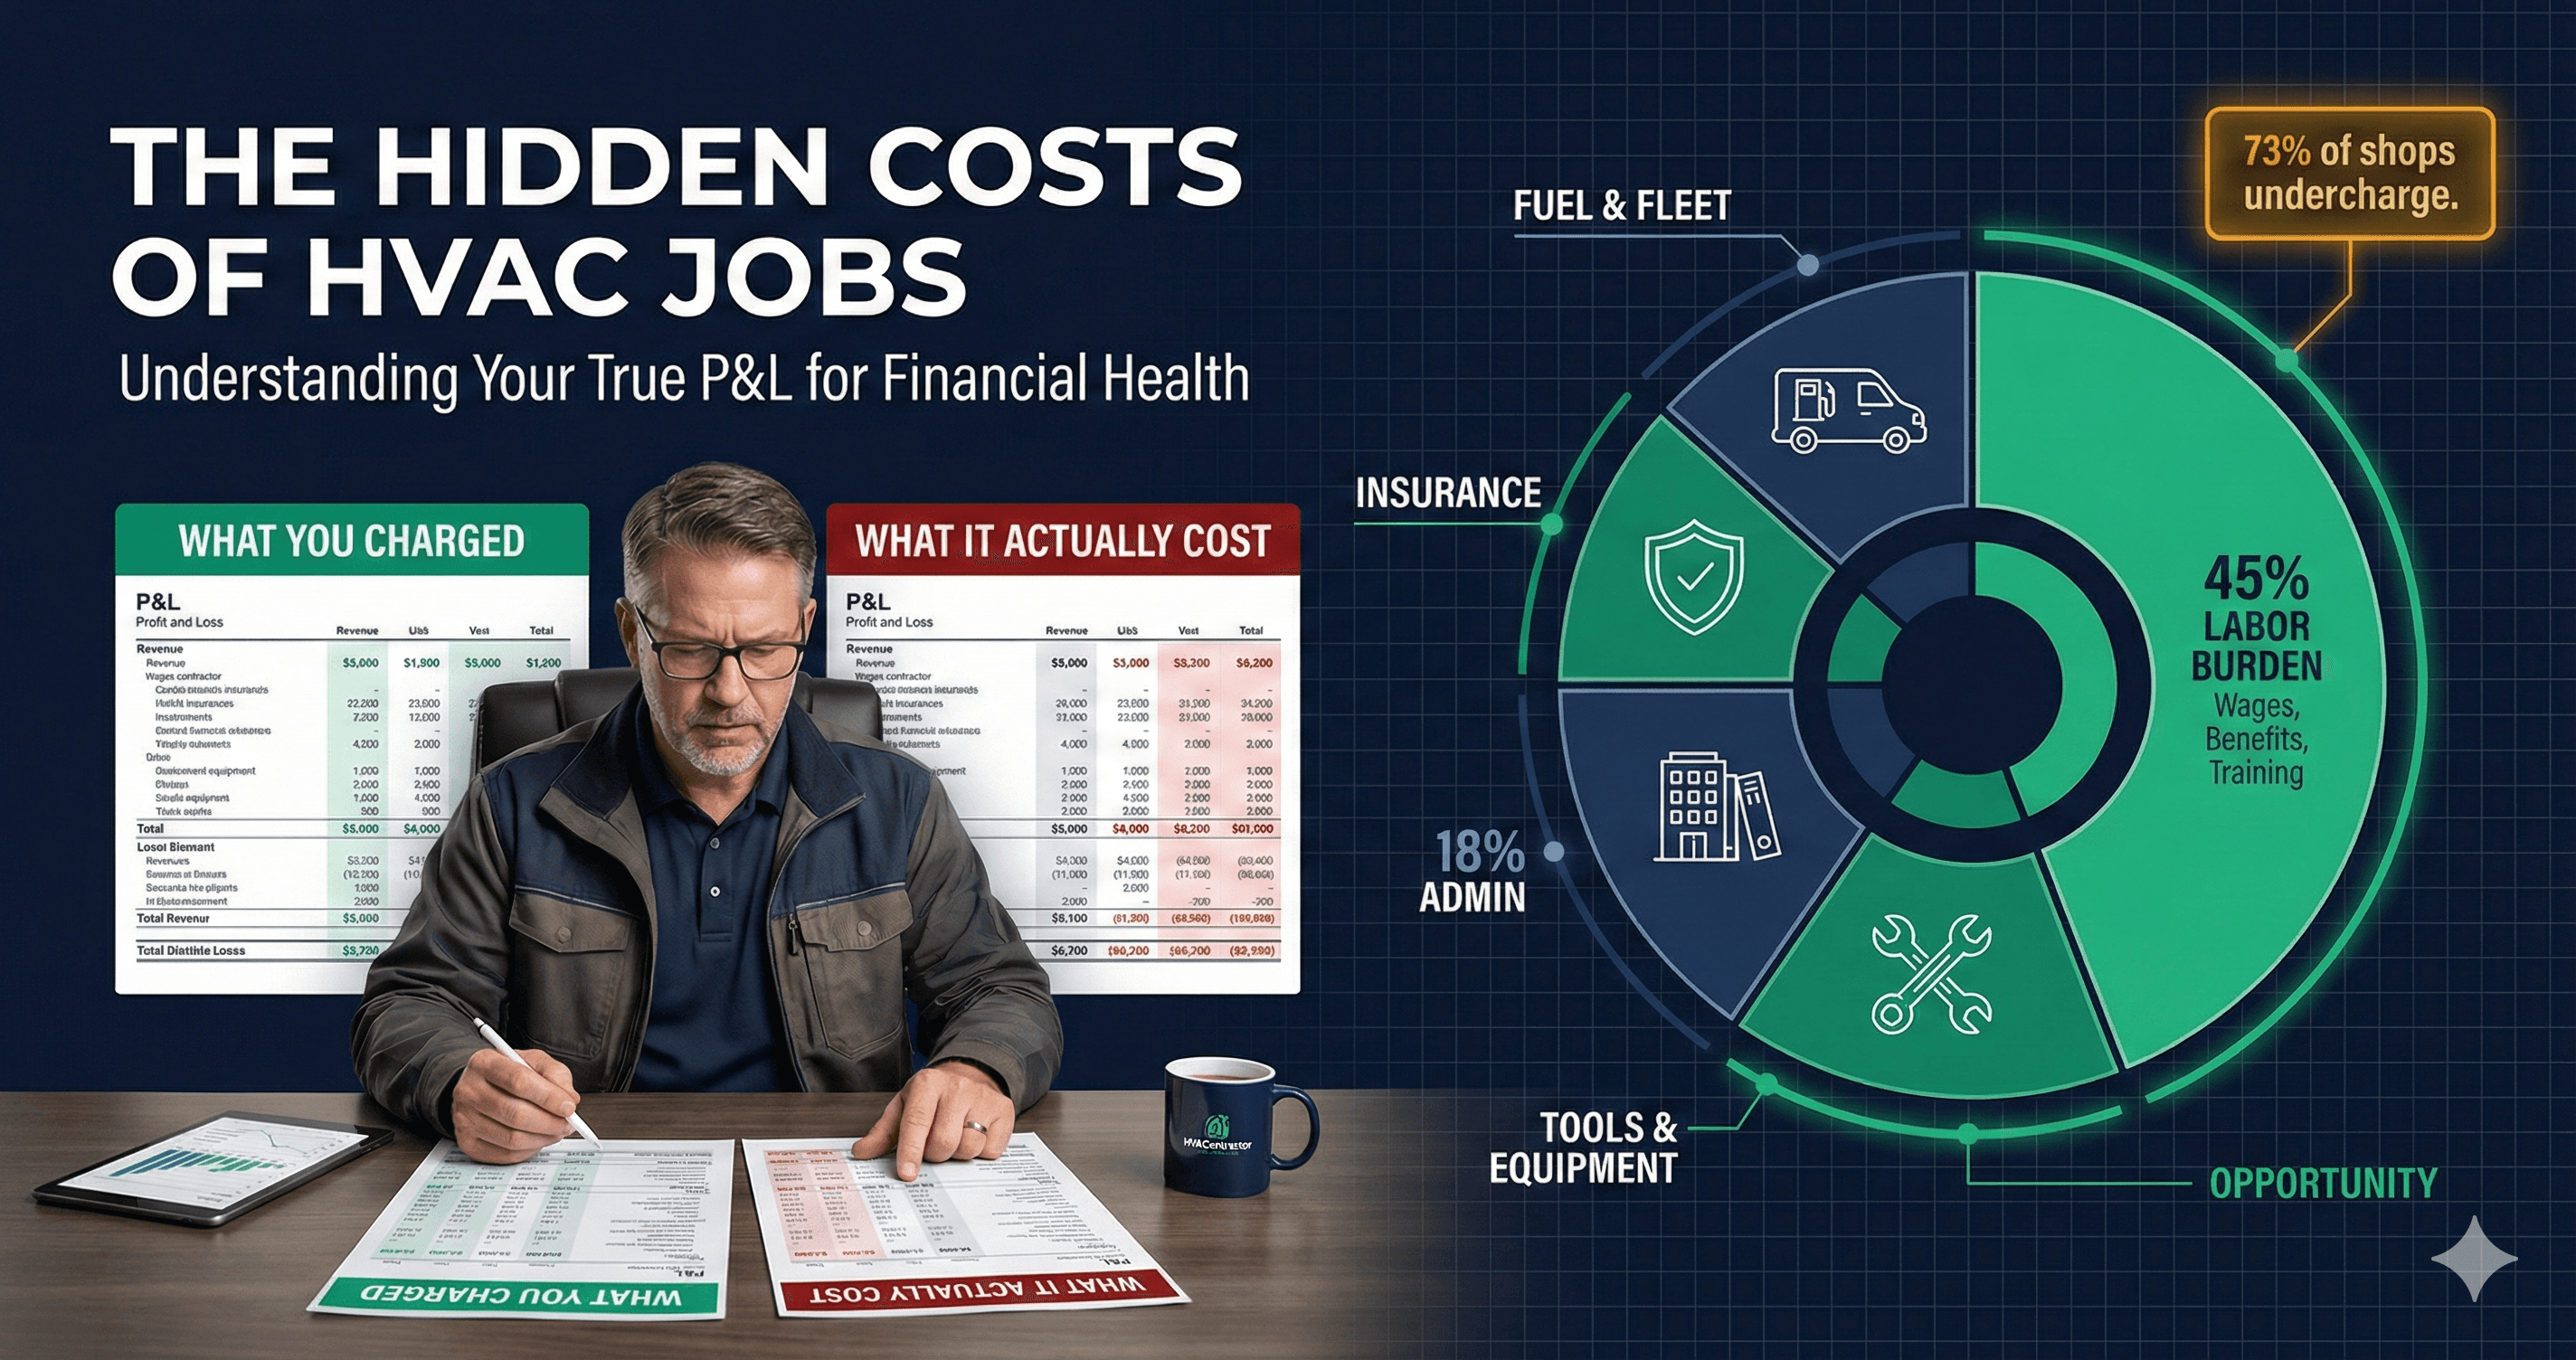
73% of HVAC Shops Are Undercharging
Industry data from 2025 shows that nearly three-quarters of residential HVAC contractors are not fully recovering overhead in their pricing. The average gap: $8.40 per billable hour. On a 10-tech shop with 8,000 billable hours annually, that is $67,200 in margin left on the table every year.
Here is the most common financial story in North Texas HVAC right now: the owner is doing more revenue than ever, the trucks are full, callbacks are up a little but manageable, and yet at the end of every month the checking account is not where it should be. There is always something eating the margin. Equipment cost increases, fuel, a tech who left and had to be replaced. It feels like bad luck or bad timing.
Most of the time it is not bad luck. It is overhead that was never properly priced into the jobs.
Overhead recovery is one of the least-discussed and most consequential financial levers in a service business. When it is wrong, every single job you complete is subsidized by your own profit margin. You are working harder to make less, and the harder you work, the worse it gets because you are scaling the deficit.
What Overhead Actually Is (And What Most Shops Miss)
Overhead is every cost required to run your business that is not directly tied to a specific job. It is not materials. It is not the direct labor hours your tech spends on a call. It is everything else — and in most HVAC operations, that everything else adds up to 35–50% of revenue.
The reason most contractors underprice overhead is simple: these costs are invisible at the job level. You see the invoice for the capacitor. You know what you paid the tech for the hour. What you do not automatically see is what fraction of your truck payment, your liability insurance, your dispatcher's salary, and your ServiceTitan subscription belongs to that specific call.
So those costs get lumped into a vague mental category called “overhead” and priced in as a rough percentage that was set years ago and never revisited. Meanwhile, every one of those costs has increased significantly since 2021.
The Five Overhead Categories Most Shops Underprice
Includes: Payroll taxes, workers’ comp, health insurance, paid time off, unemployment insurance
Why it gets missed: Most shops calculate labor cost as hourly wage only. The true cost of a $28/hr tech is $33–$36/hr once burden is added.
Includes: Truck payments or depreciation, fuel, maintenance, insurance, registration
Why it gets missed: A fully loaded service truck costs $18K–$28K/year to operate. Most shops use a flat “fuel surcharge” that covers less than half.
Includes: General liability, commercial auto, umbrella policy, license fees, continuing education
Why it gets missed: Often treated as a fixed annual cost rather than a per-job burden. It isn’t — it scales with revenue and job count.
Includes: CSR salaries, dispatcher wages, software subscriptions, office rent, accounting, marketing
Why it gets missed: Back-office costs are invisible on individual job tickets but very visible on the P&L. They’re often the most underestimated category.
Includes: Diagnostic tools, refrigerant recovery equipment, consumables, PPE, uniforms
Why it gets missed: Replaced piecemeal and rarely tracked as a running cost. Across 10 techs, tool and equipment cost easily exceeds $40K/year.
Add those five categories together and you are looking at a true overhead burden of 32–45% of revenue for a typical residential HVAC operation. Most contractors pricing with a 15–20% overhead factor are running a structural deficit on every call.
The Real Cost of a Technician: A Worked Example
Let's walk through what a technician actually costs versus what most shops think they cost. Take a mid-level tech in the DFW market at $28/hour:
True Cost of a $28/hr DFW Technician
Per billable hour, fully loaded
Base wage
What most shops price from
$28.00
Payroll taxes (FICA, FUTA, SUTA)
~13.5% of wage
$3.78
Workers’ comp insurance
~7% of wage (HVAC rate)
$1.96
Health insurance (employer share)
Avg DFW employer contribution
$2.50
PTO, holidays, sick time
~3 weeks/yr = ~8% of hours paid but unbillable
$2.24
Total labor burden
Before overhead
$38.48
Fleet allocation (truck + fuel)
Based on $24K/yr truck cost, 4,140 billable hrs
$5.80
Tools & equipment
~$8K/yr per tech, amortized
$1.90
Admin & dispatch allocation
Based on $35K admin salary / 10 techs
$4.20
Insurance & compliance
GL, commercial auto, licenses
$2.10
Software & systems
FSM, phone, scheduling tools
$1.40
True fully-loaded cost
Per billable hour
$53.88
A technician you think costs $28/hour actually costs $53.88/hour to put on a job. If your service rate is not built around that number — plus profit margin — you are losing money on every call, even when the job goes perfectly.
Most DFW contractors we speak with have a mental model of their tech cost that is $15–$20/hour lower than reality. That gap, multiplied across every billable hour in the year, is where the missing margin goes.
Why This Problem Gets Worse When Business Is Good
Here is the counterintuitive part: overhead underpricing gets more damaging as volume increases. When you are busy, you are completing more jobs, each of which is slightly underpriced. You are also adding overhead — more trucks, more admin support, more software seats — without necessarily repricing to reflect it.
A contractor doing $2M in revenue with a 5% overhead gap is leaving $100,000 on the table annually. A contractor doing $5M with the same gap is leaving $250,000. The more successful the business, the bigger the structural leak.
This is also why many contractors hit a revenue ceiling where they cannot seem to convert growth into profitability. At $3M they feel squeezed. At $4M they feel more squeezed. The problem is not growth — it is that the pricing model never caught up with the cost structure.
How to Calculate Your Actual Overhead Recovery Rate
Calculate Your True Annual Overhead
Add up every cost that isn’t direct materials or direct labor wages: all burden, fleet, insurance, admin, software, rent, marketing. Most contractors who do this for the first time land 20–35% higher than they expected.
Divide by Billable Hours
Take your total overhead number and divide by your total annual billable hours (not hours worked — billable hours). A 10-tech shop at 40% utilization has roughly 8,320 billable hours per year. That’s your overhead rate per billable hour.
Add Overhead Rate to Every Job
Your service rate should be: direct labor cost + labor burden + overhead per hour + materials + profit margin. Most shops are missing at least two of those five components in their pricing.
Audit Your Flat-Rate Book
If you use flat-rate pricing, validate that your flat rates were built with your current overhead — not overhead from 2021 or 2023. Costs have moved significantly. Flat rates that haven’t been updated in 2+ years are almost certainly underpriced.
Set a Quarterly Review Cadence
Overhead changes as you add staff, trucks, and software. Build a quarterly overhead review into your ops calendar — 30 minutes with your bookkeeper to recalculate the rate and flag any categories that have moved more than 10%.
The Flat-Rate Trap
Flat-rate pricing books — whether from a national provider like Callahan-Roach or a custom internal book — are only as accurate as the overhead inputs used to build them. If your flat-rate book was calibrated in 2022 and your overhead has increased by 18% since then (a conservative estimate given inflation, wage increases, and insurance cost growth), every job priced from that book is underpriced by 18%.
The discipline that separates high-margin shops from average shops is not using flat-rate pricing — it is updating it annually. Specifically: recalculate your overhead rate each January, adjust your flat rates accordingly, and communicate the change to your team before the spring season.
Shops that do this consistently maintain gross margins of 55–65% on service work. Shops that let their book sit for 2–3 years without recalibration typically land at 42–50% — a 10–15 point margin gap that compounds dramatically at volume.
What to Do With Existing Customers When You Reprice
This is the question every contractor asks when they realize they have been undercharging: what do I do about the customers who are used to my old pricing?
The honest answer: most residential customers are less price-sensitive than contractors fear. A $15–$25 increase in a service call rate — framed as “our rates reflect current technician and fuel costs” — results in minimal pushback in the DFW market, where homeowners are accustomed to price movement across all service categories.
For maintenance agreement customers, the cleanest approach is to grandfather them at their current rate for the remainder of their agreement term and reprice at renewal. Notify them 60 days in advance with a clear explanation. Churn on well-served agreement customers who receive a price increase notice is typically 4–8% — far lower than the margin improvement from correcting the pricing.
The Monitoring Angle: Why This Is Harder to See Without Data
One reason overhead underpricing persists is that it is invisible at the job level. ServiceTitan, Housecall Pro, and most FSM platforms show you revenue per job and materials cost per job. Very few show you overhead allocation per job, or flag when a job type is systematically underperforming on margin.
That is an operational monitoring problem. The shops that catch overhead drift early are the ones with someone regularly reviewing job-level margin data — not just total P&L — and correlating it against overhead benchmarks. When a job category's margin starts compressing, that is usually the first signal that overhead has drifted past the pricing model.
By the time it shows up clearly on the monthly P&L, the problem has typically been accumulating for 4–6 months.
A McKinney Shop Recovers $91K in Annual Margin
A McKinney-based HVAC company with 11 techs and $3.4M in revenue completed a full overhead audit in Q4 2025. Their pricing model had a 19% overhead factor built in — set in 2022. Their actual overhead was 34% of revenue. The gap: $510K in annual overhead unrecovered across their job volume. After recalibrating their flat-rate book and raising service call rates by $22, they recovered $91,000 in annual gross margin within the first full quarter — with zero increase in volume and less than 2% customer churn from the price adjustment.
True overhead rate
Recovered annual margin
Customer churn from reprice
The Bottom Line
If your revenue is growing but your bank account is not, overhead recovery is the first place to look. Not the economy. Not your techs. Not bad luck. The math of underpriced overhead is relentless — and it compounds with every job you complete.
The fix is not complicated. It requires an honest accounting of every cost in your business, a recalibrated pricing model, and a commitment to reviewing it annually instead of letting it drift.
For a 10-tech North Texas shop, correcting a 10-point overhead gap is worth $80,000–$120,000 in annual margin. That is not a marginal improvement. That is the difference between a business that builds wealth and one that stays on the treadmill.
Related Articles
North Texas Operations
We help DFW HVAC contractors identify and recover revenue leaks through operational monitoring and data analysis. Our clients stop leaving money on the table — without adding headcount or overhauling their tech stack.